AWS Open Source Blog
Simplifying serverless best practices with Lambda Powertools
Modern applications are increasingly relying on compute platforms based on containers and serverless technologies to provide scalability, cost efficiency, and agility. Although this shift toward more distributed architectures has unlocked many benefits, it has also introduced new complexity in how the applications are operated. In times past, debugging was as straightforward as logging into the server and inspecting the logs. Now, more thought is required about how to achieve the same level of observability in the applications we design.
In the Serverless Lens for the Well Architected Framework, we suggest several best practices for observability such as structured logging, distributed traces, and monitoring of metrics. In this post, I’ll demonstrate how you can use the new open source Lambda Powertools library to implement some of these best practices without needing to write lots of custom code. I’ll walk through the process of getting started with the library, with examples of the implementation drawn from a sample shopping cart microservice:

About Lambda Powertools
Lambda Powertools is an opinionated library that will help with implementing observability best practices without the undifferentiated heavy lifting. It currently supports AWS Lambda functions written in Python, with support for runtime versions 3.6 and newer. Lambda Powertools provides three core utilities:
Tracer provides a simple way to send traces from functions to AWS X-Ray to provide visibility into function calls, interactions with other AWS services, or external HTTP requests. Annotations easily can be added to traces to allow filtering traces based on key information. For example, when using Tracer, a ColdStart annotation is created for you, so you can easily group and analyze traces where there was an initialization overhead.
Logger provides a custom Python logger class that outputs structured JSON. It allows you to pass in strings or more complex objects, and will take care of serializing the log output. Common use cases—such as logging the Lambda event payload and capturing cold start information—are handled for you, including appending custom keys to the logger at anytime.
Metrics makes collecting custom metrics from your application simple, without the need to make synchronous requests to external systems. This functionality is powered by Amazon CloudWatch Embedded Metric Format (EMF), which allows for capturing metrics asynchronously. Again, convenience functionality is provided for common cases, such as validating metrics against CloudWatch EMF specification, and tracking cold starts.
Getting started
The following steps explain how to implement structured logging, add custom metrics, and enable tracing with X-ray for an example application. The example application uses AWS Serverless Application Model (AWS SAM) to manage deployment, and consists of a REST API providing shopping cart functionality, as well as a separate mock “product” service.
First, we need to add the Powertools library as a dependency for our functions. The sample application uses AWS SAM to build functions, so we just need to declare the Powertools library as a dependency by adding aws-lambda-powertools to our requirements.txt file:
/aws-serverless-shopping-cart/backend/shopping-cart-service/requirements.txt
We’ll use environment variables in the Globals sections of our application’s SAM templates to pass common configuration to Powertools. Active tracing for our Lambda functions and Amazon API Gateway stages should also be enabled, so that those services are able to create a trace if one doesn’t already exist from an upstream request:
/aws-serverless-shopping-cart/backend/shoppingcart-service.yaml
Next up, import and initialize the Metrics, Logger, and Tracer classes in the code for the Lambda functions we want to update:
Logging
We can then start using the logger to output structured logs by passing it messages as a string:
Output will be written to CloudWatch Logs as a JSON-formatted line:
We can also use the inject_lambda_context decorator with our Lambda handler to automatically enrich log entries with information about the Lambda context for log lines emitted from within the handler. Another common use case, especially when developing new Lambda functions, is to print a log of the event received by the handler. This can be achieved by passing the log_event parameter to the decorator, which is disabled by default to prevent potentially leaking sensitive event data into logs:
Having logs available as structured JSON allows us to perform searches on this structured data using CloudWatch Logs Insights. In the example, we’re searching for all logs that were output during a Lambda cold start, and displaying key fields in the output:

Tracing
By using the capture_lambda_handler decorator provided, we can instruct the library to send traces and metadata from the execution of our Lambda function to AWS X-Ray. We can capture the execution of other functions outside of the handler as well using capture_method, to provide more granular details to our traces:
By decorating our Lambda handler, once traffic is flowing we’ll be able to see a generated service map in the AWS X-Ray console, giving us an overview of all the traffic flowing through our application:

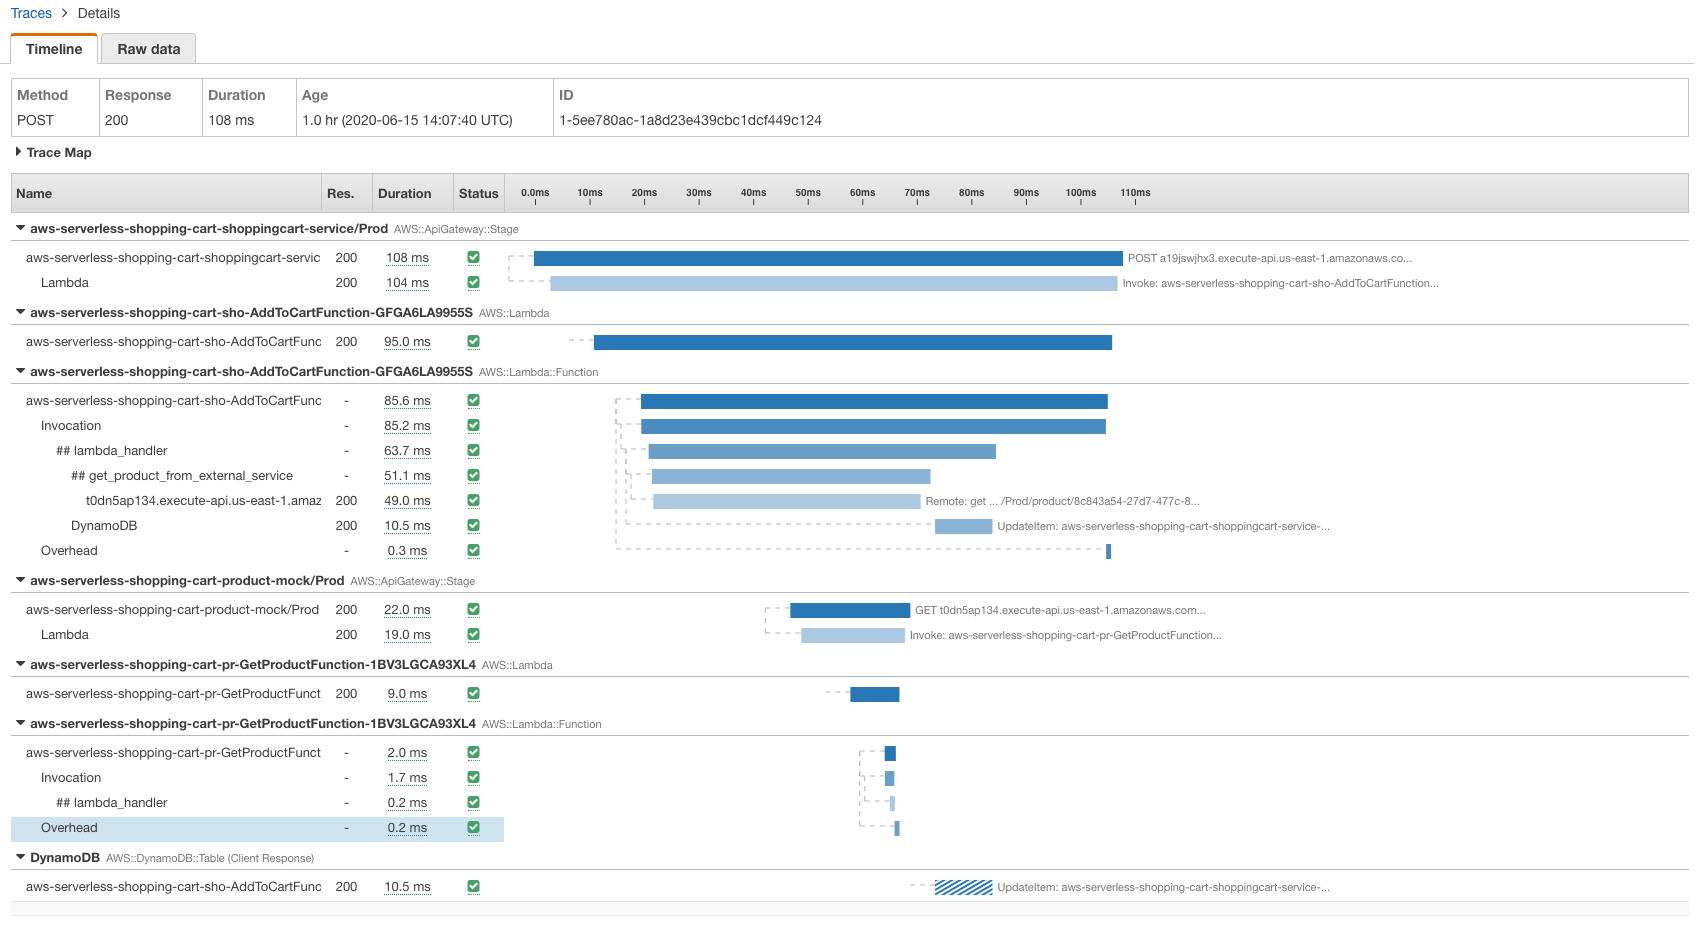
We can drill down further to view an individual trace, in this case representing a single POST request to our API to add an item to a user’s shopping cart. Following the trace map, we can see our request hits API Gateway, which in turn triggers the Add To Cart Lambda function. That function then writes data to Amazon DynamoDB, and makes a request to the product service, which itself consists of API Gateway and Lambda.

We also can view the individual traces that were generated, together with a waterfall view of the segments and subsegments that our trace is composed of. This data will be invaluable when we want to pinpoint the root cause of slow operations or errors within our application:
I also can filter traces by annotation and create custom service maps with X-Ray Trace Groups, if necessary. In this case, I can use the filter expression annotation.ColdStart = true to filter traces based on the ColdStart annotation, which Powertools adds automatically:

Metrics
Finally, let’s add custom metrics to the application. With CloudWatch, many useful metrics are available out of the box to help answer general questions about the application’s throughput, error rate, resource utilization, and the like. However, to better understand the behavior of the application and the end customers, we also need to collect custom metrics relevant to our business. In our shopping cart service, we want to understand how often our customers are adding items to their cart, or how often a user successfully purchases the items in their cart.
When organizing our metrics with Powertools, we need to think about the metrics namespace, dimensions, and the metric names. Namespace is the highest level container, which can consist of multiple services, which in turn can consist of multiple metrics. Dimensions are metrics metadata that help you slice and dice metrics visualization, for example service name, which we set as environment variables earlier and are automatically added for you by Powertools.

To create custom metrics, we start by decorating our Lambda function with log_metrics. This will make sure that all metrics are properly serialized and flushed to logs when the function finishes its execution. We can then emit custom metrics by calling add_metrics. We also can optionally pass capture_cold_start_metric parameter to log_metrics decorator to automatically create a cold start metric:
CloudWatch Metrics allows us to build visualizations for these metrics; in this case, we can see how many times shopping carts have been updated, checked out, or migrated (reassigned from an anonymous user to an authenticated one):

Bringing it all together
In many cases, we will want to use the logging, metrics, and tracing functionality all together for our Lambda functions. We can stack the decorators together, but to ensure our metrics are properly flushed we should put the log_metrics decorator at the top:
import json
import logging
import os
import boto3
from aws_lambda_powertools import Logger, Tracer, Metrics
from boto3.dynamodb.conditions import Key
from shared import get_headers, generate_ttl, handle_decimal_type, get_cart_id
logger = Logger()
tracer = Tracer()
metrics = Metrics()
dynamodb = boto3.resource("dynamodb")
logger.info("Initializing DDB Table %s", os.environ["TABLE_NAME"])
table = dynamodb.Table(os.environ["TABLE_NAME"])
@metrics.log_metrics(capture_cold_start_metric=True)
@logger.inject_lambda_context(log_event=True)
@tracer.capture_lambda_handler
def lambda_handler(event, context):
"""
Update cart table to use user identifier instead of anonymous cookie value as a key. This will be called when a user
is logged in.
"""
logger.debug(event)
cart_id, _ = get_cart_id(event["headers"])
try:
# Because this method is authorized at API gateway layer, we don't need to validate the JWT claims here
user_id = event["requestContext"]["authorizer"]["claims"]["sub"]
except KeyError:
logger.warn("Invalid user tried to check out cart")
return {
"statusCode": 400,
"headers": get_headers(cart_id),
"body": json.dumps({"message": "Invalid user"}),
}
# Get all cart items belonging to the user's identity
response = table.query(
KeyConditionExpression=Key("pk").eq(f"user#{user_id}")
& Key("sk").begins_with("product#"),
ConsistentRead=True, # Perform a strongly consistent read here to ensure we get correct and up to date cart
)
cart_items = response.get("Items")
# batch_writer will be used to update status for cart entries belonging to the user
with table.batch_writer() as batch:
for item in cart_items:
# Delete ordered items
batch.delete_item(Key={"pk": item["pk"], "sk": item["sk"]})
metrics.add_metric(name="CartCheckedOut", unit="Count", value=1)
logger.info({"action": "CartCheckedOut", "cartItems": cart_items})
return {
"statusCode": 200,
"headers": get_headers(cart_id),
"body": json.dumps(
{"products": response.get("Items")}, default=handle_decimal_type
),
}Bonus: Bring your own middleware utility
On top of the core utilities described above, the library provides a middleware factory utility named lambda_handler_decorator. This provides a simple way to hook up custom logic to the Lambda request lifecycle, executing code before and after your handler. Your middleware has access to the event, context, and response from the handler:
You might want to add custom validation for event payloads, or custom serialization for responses. Implementing this from scratch can be time consuming and error prone; instead, use the middleware factory to abstract away complexity.
Conclusion
Amazon CloudWatch and AWS X-Ray provide lots of functionality that can be used to provide comprehensive observability for your applications. If you’re using AWS Lambda to run your Python functions, the Lambda Powertools library can help you to get the most value from those services, while minimizing the amount of custom code you need to write. If you’d like to expand on the examples provided in this post, you can see the changes I made to start using the Powertools library in the sample shopping cart application on GitHub.
Lambda Powertools is generally available now and we’d love to hear your feedback on what you build with it.
You can find the full documentation for Lambda Powertools and the source code in Github. Contributions are welcomed via pull request, and I encourage you to create an issue if you have any feedback for the project.