This article is part of #ServerlessSeptember. You'll find other helpful articles, detailed tutorials, and videos in this all-things-Serverless content collection. New articles are published every day — that's right, every day — from community members and cloud advocates in the month of September.
Find out more about how Microsoft Azure enables your Serverless functions at https://docs.microsoft.com/azure/azure-functions/.
Some quick facts about the Twitterbot
In my previous post, I wrote about why and how I created the Azure Functions Updates Twitterbot. This bot has been posting updates about Azure Functions related GitHub repositories (and Azure Service announcements) since February 2019, so that's well over 6 months. It monitors 24 repositories, including itself, and the Azure Service Updates RSS feed, filtered for Azure Functions related updates. The full list of sources is listed on GitHub. The function app that runs the bot has captured 128 GitHub releases, 8 Azure Service Update posts and posted 154 messages to Twitter (the introductory tweets were posted manually).
In this post, I want to highlight some of the actions I took and the insights I've got after I put the Twitterbot live. I'm going to cover: failure & resiliency, monitoring & alerts, performance, and costs.
1. Failure & resiliency

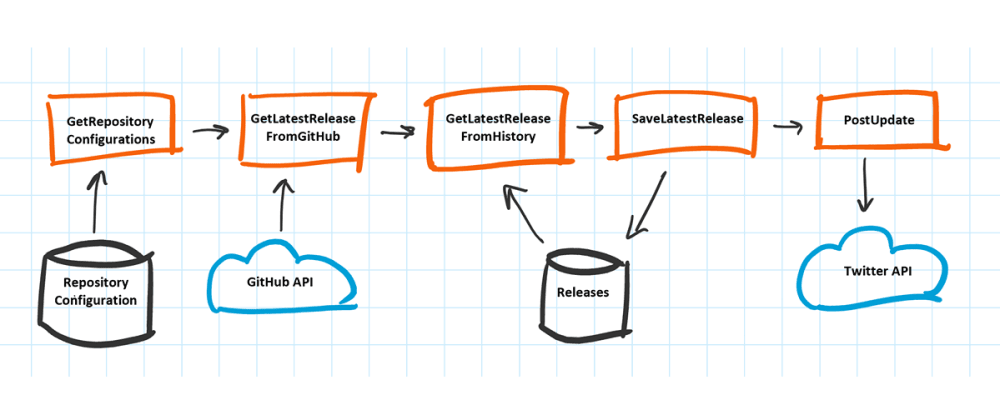
Looking at the component diagram above, three external dependencies are shown; GitHub, Twitter and Azure Table Storage. (Note that this is the initial design of the application, it has been extended later to include the Azure Service Updates RSS feed.)
Every service has some planned or unplanned downtime, so the function app has to cope with short service interruptions for its dependencies. Luckily the Durable Functions API provides a built-in mechanism to deal with this; it can perform retries on activity functions. Activity functions are called from the orchestrator function with the CallActivityWithRetryAsync method. Here's an example where the GetLatestReleaseFromGitHub activity function is called:
// Get most recent release from GitHub
getLatestReleaseFromGitHubTasks.Add(context.CallActivityWithRetryAsync<RepositoryRelease>(
    nameof(GetLatestReleaseFromGitHub),
    GetDefaultRetryOptions(),
    repositoryConfiguration));
The second argument in this method specifies the RetryOptions. With that, you can control how many times and with what frequency the activity function is retried when it fails. Since I reuse the same retry options at different places in the orchestrator, I have put it in a separate method:
private static RetryOptions GetDefaultRetryOptions()
{
    return new RetryOptions(TimeSpan.FromMinutes(1), 3);
}
Using the above RetryOptions, when an activity function fails, the Durable Functions framework retries the execution of the activity for a maximum of 3 times with an interval of 1 minute. You can even specify a BackoffCoefficient to do exponential backoff which slows down the retries after each execution.
There were several occasions where the GitHub API returned a gateway time-out (504), and by having this retry policy in place, the activity function execution always succeeded eventually.
2. Monitoring & Alerts
In case something goes wrong with the function app which is not recoverable with retries I want to receive a notification so I can look into the issue. The function app only delivers value when it's posting updates to Twitter. Therefore I've configured an alert which sends me an email when the PostUpdate activity function fails 3 times within one hour (equal to the maximum amount of retries). The image below shows the alert configuration:

Notice that the top right shows a chart with the selected signal events in a time window. In this case, it shows 6 occasions of PostUpdate activity failures within one week. I found this graph quite helpful to look for meaningful signals.
When Application Insights is enabled for the function app, there are many options for signal selection when configuring the condition of the alert. As can be seen in the image below, the success rate, failure rate, and min/max/avg durations of the functions can be chosen as the signal source:

3. Performance
This function app is a very low volume application. It is triggered once every hour, which results in about 51k function executions per month. Even though a high volume or performance is not of my concern in this situation, it is interesting to see how the function app and its dependencies perform. The Application Map below shows the connections from the function app in the center to its dependent resources. The data shown is aggregated for 24 hours:

The first time I looked at the Application Map it struck me that there were only 22 instances of the function app. I expected 24 instances since the function app runs every hour. However, it appears that instances are sometimes reused. In this case, two instances had been reused, which explains the 22 individual instances over 24 hours.
The calls to the Azure Service Updates RSS feed take the longest, 1 sec on average. The calls to Azure Table storage and Queue storage are the fastest, 148.6ms and 109.7ms on average.
Let's look deeper into the performance of the GitHub and Twitter HTTP APIs. Here's a chart that shows the average duration of the HTTP calls in August:

I recommend looking at these dependency response time charts because they can reveal trends about the performance of the dependencies over time. In this case, there is an apparent increase in duration around 11 to 13 Aug (GitHub was slower in its response then) and after that, the average duration stabilizes around 0.8s.
Looking at the duration distribution of all calls, we see a large spread ranging from 120ms to 2.9s:

There's nothing I can do about the performance of the external dependencies, but it is important to realize that calls to other systems are never constant. The network is not 100% reliable and latency is never 0. I recommend reading about the fallacies of distributed computing.
Something which is under my control are the functions I wrote myself. Here's the distribution chart for the ReleaseUpdateOrchestration function:

Again there is a wide distribution of durations. Part of this variance is due to performance differences across function app instances, but another factor is that orchestrator functions are replayed several times and each time they proceed further in the orchestrator code and take longer to complete. I plan to do a more thorough investigation of how significant this effect is.
4. Costs
I wanted a cheap solution for this bot. I'm running this application as a personal side project and no-one else is paying for it. I made a rough calculation up front and realized that the cost would be minimal since the first 1 million executions for the Azure Functions consumption plan are free. In addition, I'm using a tiny set of data (repository, release, and announcement information) which is stored in Azure Table Storage, which is very cheap to use.
Cost breakdown
When we look at the accumulated costs of the resource group since its inception, it's clear the costs are extremely low, only 1.22 Euro from Feb-Aug 2019.

The bright-green part of the chart is the actual costs until the 1st of September. The lighter green is the forecast costs. I think the forecast is a bit on the high side, there aren't any new GitHub repositories to monitor (although I'm looking to include other sources) and the number of releases is unlikely to change drastically. Nevertheless, it's a nice feature to have this forecast.
The three donut charts below are different cost breakdowns. The one on the left is per Meter category which is comparable with the different service types. The service which is most costly (1.21 EUR) is the storage account.
The middle donut chart breaks the cost down per Meter subcategory; this is already more insightful because it shows that storage queues are the highest cost. It is important to realize that Durable Functions relies heavily on queues to schedule the orchestrator and activity functions. So this cost is explainable but might be unexpected if one is not aware of the inner workings of Durable Functions.
Finally, on the right, the cost is broken down per Meter. Some of this information is clear such as lrs data stored (LRS=locally redundant storage), but others are a bit more cryptic, like class 1 and class 2 operations. Microsoft made this classification to group certain operations together which have equal cost. Class 1 is related to create, put, update, and delete operations on queue messages. Class 2 is related to get and peek operations on messages.
Learnings
I had the opportunity to attend the Advanced Distributed Systems Design course by Udi Dahan earlier this year and that was really an eye-opener. It really helped me to understand the fallacies of distributed computing better and how to act on them. The Twitterbot I made is a very small application and has little impact in case it does not work, but it proved to be a nice playground to put some learnings into practice.
Failures are inevitable, so you better be prepared to have the system cope with it where possible and have a good process & tooling in place to respond to issues. In my case, I had build & release pipelines configured in Azure DevOps from the start, which enabled automated unit testing and pushing fixes to production quickly.
You need monitoring and alerts setup when you're running in production; otherwise, you're blind to anything that happens. Try to identify a small set of most important metrics and only put alerts on those.
To really understand how your solution is performing you need to see how it's running in production. Enable Application Insights and spend a good amount of time navigating through the various blades in the Azure Portal. The Application Map, Failures and Performance blades are easy to get started with and provide a wealth of information.
The Azure Functions Consumption plan combined with table/blob storage is cheap for low to medium volume workloads. Make an effort in calculating the function executions up-front, so you have an educated guess if a Consumption plan or App Service plan is best for your situation. Note that by using Durable Functions, you'll pay a bit more due to queue and table storage usage and more function executions. However, don't let this hold you back. The Durable Functions framework provides many great features out of the box, which you don't need to write and maintain yourself. So I'm pretty confident the benefits outweigh the costs.
Open source
The code for the Twitterbot is on GitHub so if you want to look at the details feel free to clone or fork it. I have plans to extend the bot with more features if you have additional ideas, feel free to add those as issues or submit a PR :).


Top comments (0)