AWS Compute Blog
Introducing AWS Lambda Powertools for .NET
This blog post is written by Amir Khairalomoum, Senior Solutions Architect.
Modern applications are built with modular architectural patterns, serverless operational models, and agile developer processes. They allow you to innovate faster, reduce risk, accelerate time to market, and decrease your total cost of ownership (TCO). A microservices architecture comprises many distributed parts that can introduce complexity to application observability. Modern observability must respond to this complexity, the increased frequency of software deployments, and the short-lived nature of AWS Lambda execution environments.
The Serverless Applications Lens for the AWS Well-Architected Framework focuses on how to design, deploy, and architect your serverless application workloads in the AWS Cloud. AWS Lambda Powertools for .NET translates some of the best practices defined in the serverless lens into a suite of utilities. You can use these in your application to apply structured logging, distributed tracing, and monitoring of metrics.
Following the community’s continued adoption of AWS Lambda Powertools for Python, Java, and TypeScript, AWS Lambda Powertools for .NET is now generally available.
This post shows how to use the new open source Powertools library to implement observability best practices with minimal coding. It walks through getting started, with the provided examples available in the Powertools GitHub repository.
About Powertools
Powertools for .NET is a suite of utilities that helps with implementing observability best practices without needing to write additional custom code. It currently supports Lambda functions written in C#, with support for runtime versions .NET 6 and newer. Powertools provides three core utilities:
- Tracing provides a simpler way to send traces from functions to AWS X-Ray. It provides visibility into function calls, interactions with other AWS services, or external HTTP requests. You can add attributes to traces to allow filtering based on key information. For example, when using the Tracing attribute, it creates a ColdStart annotation. You can easily group and analyze traces to understand the initialization process.
- Logging provides a custom logger that outputs structured JSON. It allows you to pass in strings or more complex objects, and takes care of serializing the log output. The logger handles common use cases, such as logging the Lambda event payload, and capturing cold start information. This includes appending custom keys to the logger.
- Metrics simplifies collecting custom metrics from your application, without the need to make synchronous requests to external systems. This functionality allows capturing metrics asynchronously using Amazon CloudWatch Embedded Metric Format (EMF) which reduces latency and cost. This provides convenient functionality for common cases, such as validating metrics against CloudWatch EMF specification and tracking cold starts.
Getting started
The following steps explain how to use Powertools to implement structured logging, add custom metrics, and enable tracing with AWS X-Ray. The example application consists of an Amazon API Gateway endpoint, a Lambda function, and an Amazon DynamoDB table. It uses the AWS Serverless Application Model (AWS SAM) to manage the deployment.
When you send a GET request to the API Gateway endpoint, the Lambda function is invoked. This function calls a location API to find the IP address, stores it in the DynamoDB table, and returns it with a greeting message to the client.

Example application
The AWS Lambda Powertools for .NET utilities are available as NuGet packages. Each core utility has a separate NuGet package. It allows you to add only the packages you need. This helps to make the Lambda package size smaller, which can improve the performance.
To implement each of these core utilities in a separate example, use the Globals sections of the AWS SAM template to configure Powertools environment variables and enable active tracing for all Lambda functions and Amazon API Gateway stages.
Sometimes resources that you declare in an AWS SAM template have common configurations. Instead of duplicating this information in every resource, you can declare them once in the Globals section and let your resources inherit them.
Logging
The following steps explain how to implement structured logging in an application. The logging example shows you how to use the logging feature.
To add the Powertools logging library to your project, install the packages from NuGet gallery, from Visual Studio editor, or by using following .NET CLI command:
dotnet add package AWS.Lambda.Powertools.LoggingUse environment variables in the Globals sections of the AWS SAM template to configure the logging library:
  Globals:
    Function:
      Environment:
        Variables:
          POWERTOOLS_SERVICE_NAME: powertools-dotnet-logging-sample
          POWERTOOLS_LOG_LEVEL: Debug
          POWERTOOLS_LOGGER_CASE: SnakeCase
Decorate the Lambda function handler method with the Logging attribute in the code. This enables the utility and allows you to use the Logger functionality to output structured logs by passing messages as a string. For example:
Lambda sends the output to Amazon CloudWatch Logs as a JSON-formatted line.
{
  "cold_start": true,
  "xray_trace_id": "1-621b9125-0a3b544c0244dae940ab3405",
  "function_name": "powertools-dotnet-tracing-sampl-HelloWorldFunction-v0F2GJwy5r1V",
  "function_version": "$LATEST",
  "function_memory_size": 256,
  "function_arn": "arn:aws:lambda:eu-west-2:286043031651:function:powertools-dotnet-tracing-sample-HelloWorldFunction-v0F2GJwy5r1V",
  "function_request_id": "3ad9140b-b156-406e-b314-5ac414fecde1",
  "timestamp": "2022-02-27T14:56:39.2737371Z",
  "level": "Information",
  "service": "powertools-dotnet-sample",
  "name": "AWS.Lambda.Powertools.Logging.Logger",
  "message": "Getting ip address from external service"
}
Another common use case, especially when developing new Lambda functions, is to print a log of the event received by the handler. You can achieve this by enabling LogEvent on the Logging attribute. This is disabled by default to prevent potentially leaking sensitive event data into logs.
With logs available as structured JSON, you can perform searches on this structured data using CloudWatch Logs Insights. To search for all logs that were output during a Lambda cold start, and display the key fields in the output, run following query:

CloudWatch Logs Insights query for cold starts
Tracing
Using the Tracing attribute, you can instruct the library to send traces and metadata from the Lambda function invocation to AWS X-Ray using the AWS X-Ray SDK for .NET. The tracing example shows you how to use the tracing feature.
When your application makes calls to AWS services, the SDK tracks downstream calls in subsegments. AWS services that support tracing, and resources that you access within those services, appear as downstream nodes on the service map in the X-Ray console.
You can instrument all of your AWS SDK for .NET clients by calling RegisterXRayForAllServices before you create them.
To add the Powertools tracing library to your project, install the packages from NuGet gallery, from Visual Studio editor, or by using following .NET CLI command:
dotnet add package AWS.Lambda.Powertools.TracingUse environment variables in the Globals sections of the AWS SAM template to configure the tracing library.
  Globals:
    Function:
      Tracing: Active
      Environment:
        Variables:
          POWERTOOLS_SERVICE_NAME: powertools-dotnet-tracing-sample
          POWERTOOLS_TRACER_CAPTURE_RESPONSE: true
          POWERTOOLS_TRACER_CAPTURE_ERROR: true
Decorate the Lambda function handler method with the Tracing attribute to enable the utility. To provide more granular details for your traces, you can use the same attribute to capture the invocation of other functions outside of the handler. For example:
Once traffic is flowing, you see a generated service map in the AWS X-Ray console. Decorating the Lambda function handler method, or any other method in the chain with the Tracing attribute, provides an overview of all the traffic flowing through the application.

AWS X-Ray trace service view
You can also view the individual traces that are generated, along with a waterfall view of the segments and subsegments that comprise your trace. This data can help you pinpoint the root cause of slow operations or errors within your application.

AWS X-Ray waterfall trace view
You can also filter traces by annotation and create custom service maps with AWS X-Ray Trace groups. In this example, use the filter expression annotation.ColdStart = true to filter traces based on the ColdStart annotation. The Tracing attribute adds these automatically when used within the handler method.
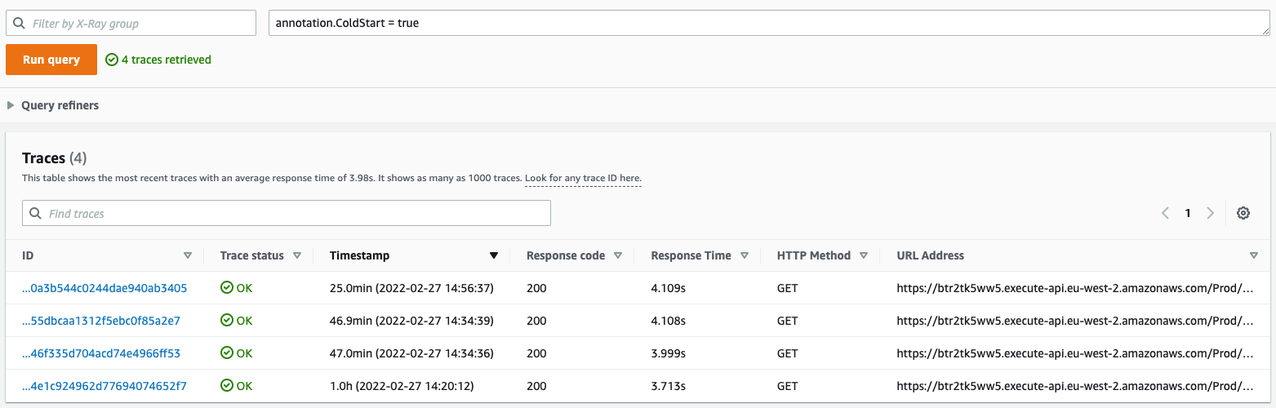
View trace attributes
Metrics
CloudWatch offers a number of included metrics to help answer general questions about the application’s throughput, error rate, and resource utilization. However, to understand the behavior of the application better, you should also add custom metrics relevant to your workload.
The metrics utility creates custom metrics asynchronously by logging metrics to standard output using the Amazon CloudWatch Embedded Metric Format (EMF).
In the sample application, you want to understand how often your service is calling the location API to identify the IP addresses. The metrics example shows you how to use the metrics feature.
To add the Powertools metrics library to your project, install the packages from the NuGet gallery, from the Visual Studio editor, or by using the following .NET CLI command:
dotnet add package AWS.Lambda.Powertools.MetricsUse environment variables in the Globals sections of the AWS SAM template to configure the metrics library:
  Globals:
    Function:
      Environment:
        Variables:
          POWERTOOLS_SERVICE_NAME: powertools-dotnet-metrics-sample
          POWERTOOLS_METRICS_NAMESPACE: AWSLambdaPowertools
To create custom metrics, decorate the Lambda function with the Metrics attribute. This ensures that all metrics are properly serialized and flushed to logs when the function finishes its invocation.
You can then emit custom metrics by calling AddMetric or push a single metric with a custom namespace, service and dimensions by calling PushSingleMetric. You can also enable the CaptureColdStart on the attribute to automatically create a cold start metric.
Conclusion
CloudWatch and AWS X-Ray offer functionality that provides comprehensive observability for your applications. Lambda Powertools .NET is now generally available. The library helps implement observability when running Lambda functions based on .NET 6 while reducing the amount of custom code.
It simplifies implementing the observability best practices defined in the Serverless Applications Lens for the AWS Well-Architected Framework for a serverless application and allows you to focus more time on the business logic.
You can find the full documentation and the source code for Powertools in GitHub. We welcome contributions via pull request, and encourage you to create an issue if you have any feedback for the project. Happy building with AWS Lambda Powertools for .NET.
For more serverless learning resources, visit Serverless Land.