Building an automated data pipeline from BigQuery to Earth Engine with Cloud Functions
Grace Coleman
Cloud Geographer
Over the years, vast amounts of satellite data have been collected and ever more granular data are being collected everyday. Until recently, those data have been an untapped asset in the commercial space. This is largely because the tools required for large scale analysis of this type of data were not readily available and neither was the satellite imagery itself. Thanks to Earth Engine, a planetary-scale platform for Earth science data & analysis, that is no longer the case.
The platform, which was recently announced as a generally available Google Cloud Platform (GCP) product, now allows commercial users across industries to operationalize remotely sensed data. Some Earth Engine use cases that are already being explored include sustainable sourcing, climate risk detection, sustainable agriculture, and natural resource management. Developing spatially focused solutions for these use cases with Earth Engine unlocks distinct insights for improving business operations. Automating those solutions produces insights faster, removes toil and limits the introduction of error.
The automated data pipeline discussed in this post brings data from BigQuery into Earth Engine and is in the context of a sustainable sourcing use case for a fictional consumer packaged goods company, Cymbal. This use case requires two types of data. The first is data that Cymbal already has and the second is data that is provided by Earth Engine and the Earth Engine Data Catalog. In this example, the data owned by Cymbal is starting in BigQuery and flowing through the data pipeline into Earth Engine through an automated process.
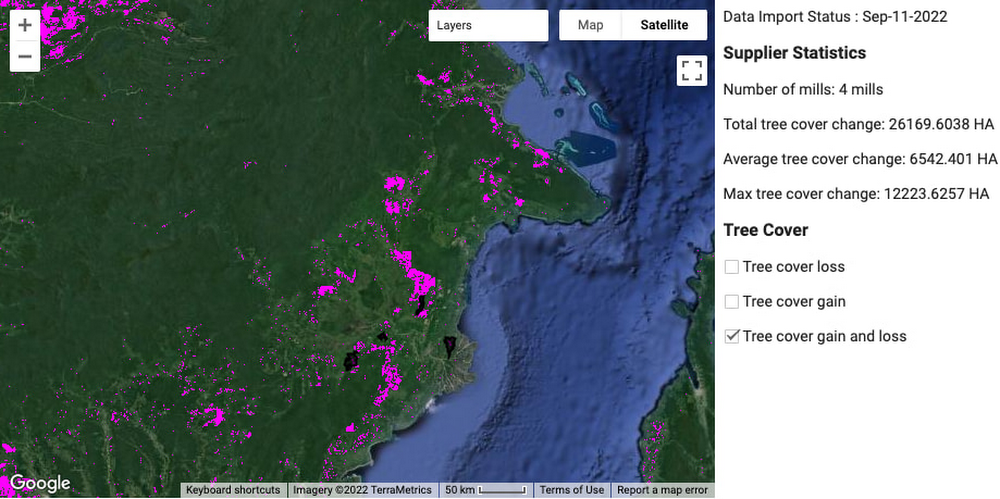
A helpful way to think about combining these data is as a layering process, similar to assembling a cake. Let’s talk through the layers for this use case. The base layer is satellite imagery, or raster data, provided by Earth Engine. The second layer is the locations of palm plantations provided by Cymbal, outlined in black in the image below. The third and final layer is tree cover data from the data catalog, the pink areas below. Just like the layers of a cake, these data layers come together to produce the final product. The goal of this architecture is to automate the aggregation of the data layers.
Another example of a use case where this architecture could be applied is in a methane emission detection use case. In that case, the first layer would remain the same. The second layer would be facility location details (i.e. name and facility type) provided by the company or organization. Methane emission data from the data catalog would be the third layer. As with methane detection and sustainable supply chain, most use cases will involve some tabular data collected by companies or organizations. Because the data are tabular, BigQuery is a natural starting point. To learn more about tabular versus raster data and when to use BigQuery versus Earth Engine, check out this post.
Now that you understand the potential value of using Earth Engine and BigQuery together in an automated pipeline, we will go through the architecture itself. In the next section, you will see how to automate the flow of data from GCP products, like BigQuery, into Earth Engine for analysis using Cloud Functions. If you are curious about how to move data from Earth Engine into BigQuery you can read about it in this post.
Architecture Walkthrough
Cymbal has the goal of gaining more clarity in their palm oil supply chain which is primarily located in Indonesia. Their specific goal is to identify areas of potential deforestation. In this section, you will see how we can move the data Cymbal already has about the locations of palm plantations into Earth Engine in order to map those territories over satellite images to equip Cymbal with information about what is happening on the ground. Let’s walk through the architecture step by step to better understand how all of the pieces fit together. If you’d like to follow along with the code for this architecture, you can find it here.
Architecture
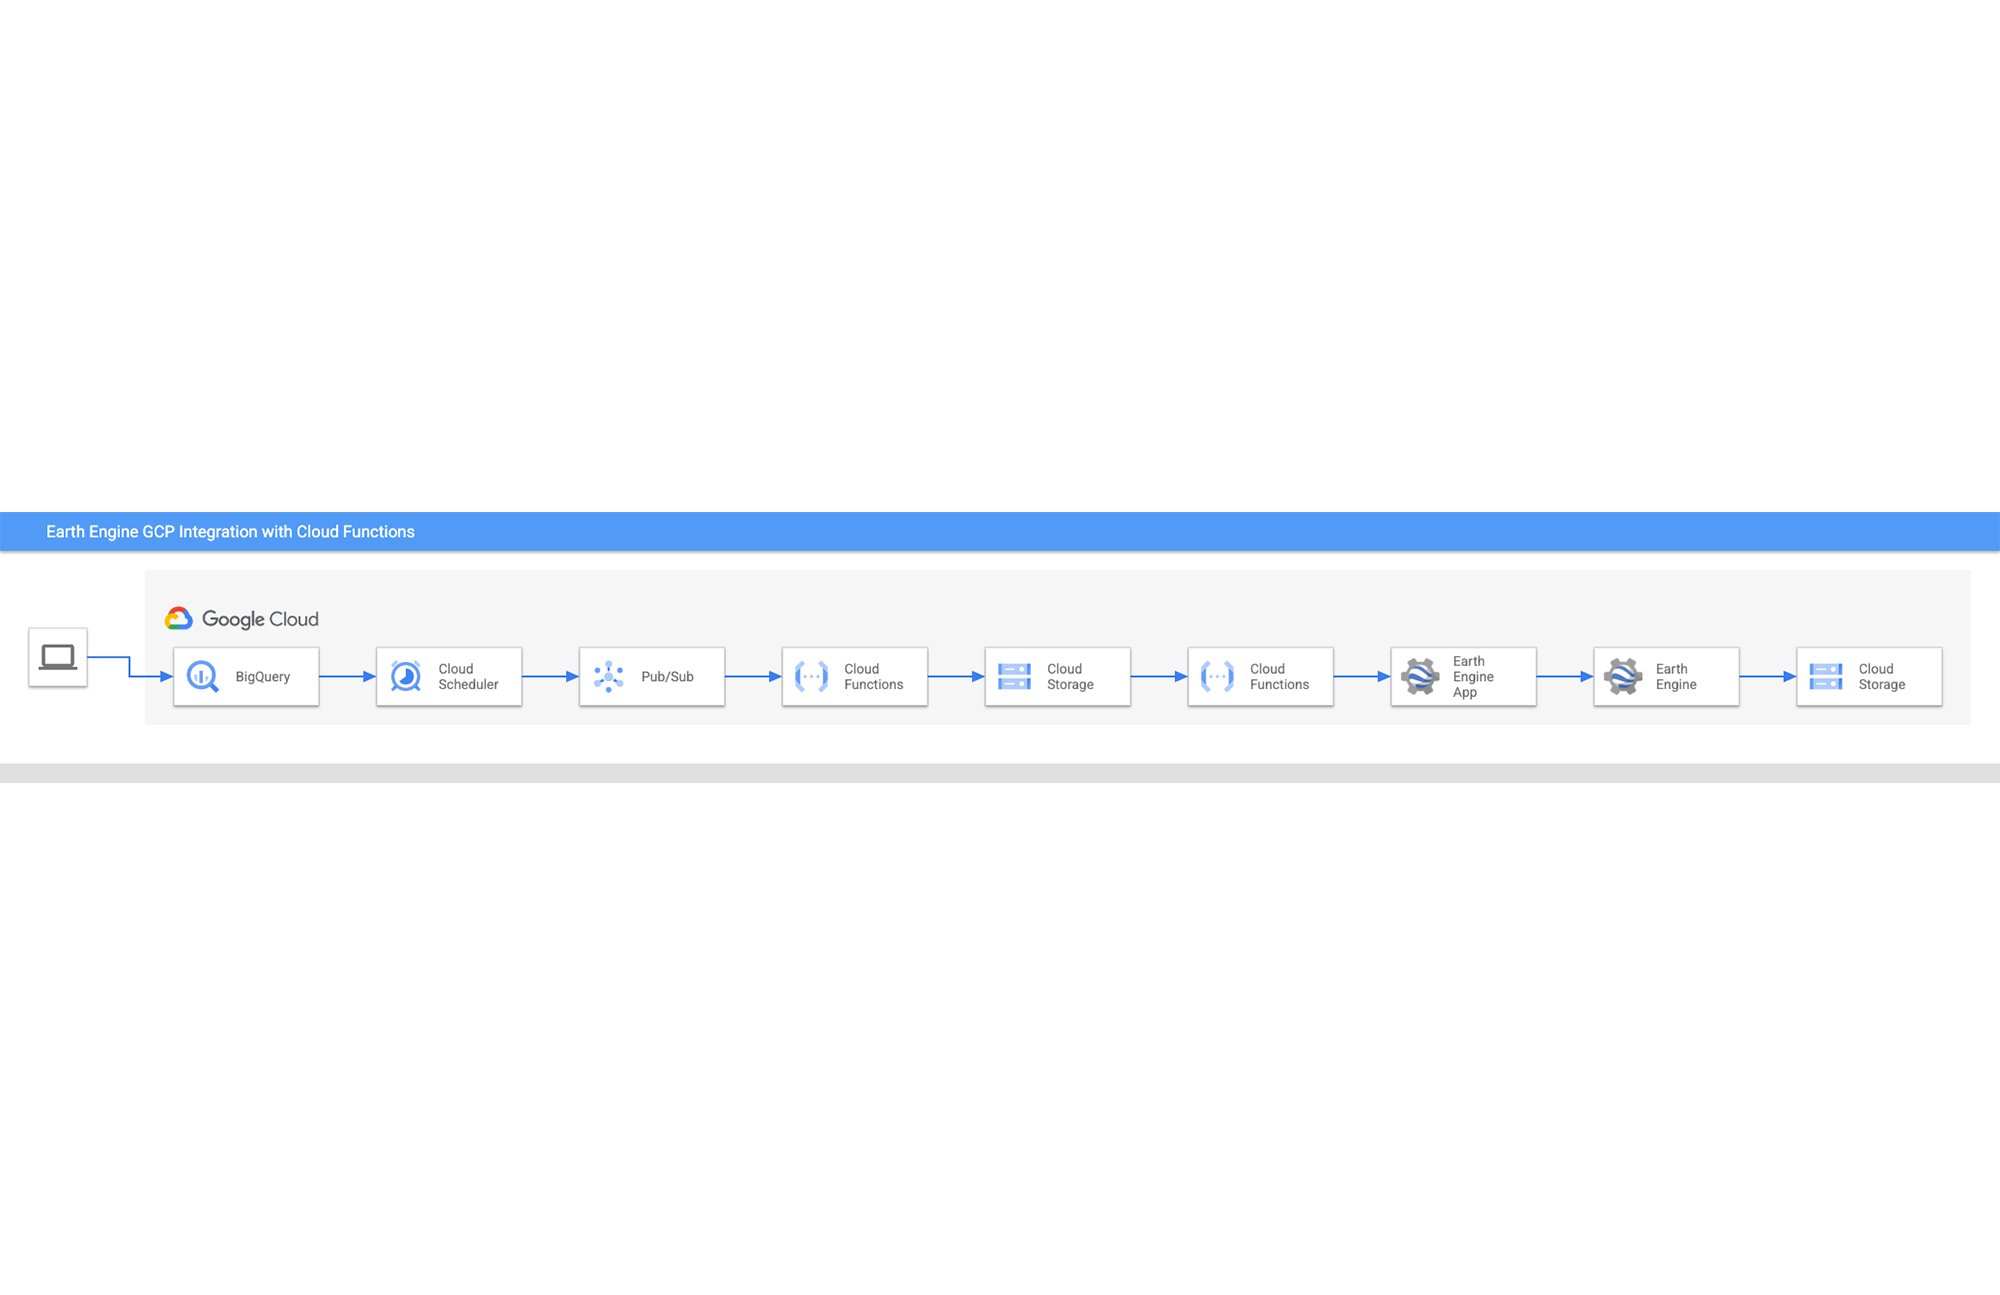
Step by Step Walkthrough
1. Import Geospatial data into BigQuery
Cymbal’s Geospatial Data Scientist is responsible for the management of the data they have about the locations of palm plantations and how it arrives in BigQuery.
2. A Cloud Scheduler task sends a message to a Pub/Sub topic
A Cloud Scheduler task is responsible for starting the pipeline in motion. Cloud Scheduler tasks are cron tasks and can be scheduled at any frequency that fits your workflow. When the task runs it sends a message to a Pub/Sub topic.
3. The Pub/Sub topic receives a message and triggers a Cloud Function
4. The first Cloud Function transfers the data from BigQuery to Cloud Storage
The data must be moved into Cloud Storage so that it can be used to create an Earth Engine asset.
5. The data arrives in the Cloud Storage bucket and triggers a second Cloud Function
6. The second Cloud Function makes a call to the Earth Engine API and creates an asset in Earth Engine
The Cloud Function starts by authenticating with Earth Engine. It then makes an API call creating an Earth Engine asset from the Geospatial data that is in Cloud Storage.
7. An Earth Engine App (EE App) is updated when the asset gets created in Earth Engine
This EE App is primarily for the decision makers at Cymbal who are primarily interested in high impact metrics. The application is a dashboard giving the user visibility into metrics and visualizations without having to get bogged down in code.
8. A script for advanced analytics is made accessible from the EE App
An environment for advanced analytics in the Earth Engine code editor is created and made available through the EE App for Cymbal’s technical users. The environment gives the technical users a place to dig deeper into any questions that arise from decision makers about areas of potential deforestation.
9. Results from analysis in Earth Engine can be exported back to Cloud Storage
When a technical user is finished with their further analysis in the advanced analytics environment they have the option to run a task and export their findings to Cloud Storage. From there, they can continue their workflow however they see fit.
With these nine high-level steps, an automated workflow is achieved that provides a solution for Cymbal, giving them visibility into their palm oil supply chain. Not only does the solution address the company wide goal, it also keeps in mind the needs of various types of users at Cymbal.
Summary
We’ve just walked through the architecture for an automated data pipeline from BigQuery to Earth Engine using Cloud Functions. The best way to deepen your understanding of this architecture and how all of the pieces fit together is to walk through building the architecture in your own environment. We’ve made building out the architecture easy by providing a Terraform Script available on GitHub. Once you have the architecture built out, try swapping out different elements of the pipeline to make it more applicable to your own operations. If you are looking for some inspiration or are curious to see another example, be sure to take a look at this post which brings data from Earth Engine into BigQuery. The post walks through creating a Cloud Function that pulls temperature and vegetation data from the Landsat satellite imagery within the GEE Catalog from SQL in BigQuery. Thanks for reading.