Optimising serverless for BBC Online

Johnathan Ishmael
Lead Technical Architect, Digital Products Group
Tagged with:

The BBC Homepage, powered by serverless.
Previously I talked about why Web Core, our new web technology platform is built using serverless cloud functions. In this post we’ll discuss our experience of integrating them with our architecture and how we’ve optimised them for our use case.
The BBC makes use of many different technology providers to deliver its online services. We make use of AWS’s Lambda service to deliver the serverless functionality for Web Core. There are other platforms which provide similar functionality, such as GCP’s Cloud Functions, Azure’s Functions, and Apache’s OpenWhisk. The majority of points made can be applied to any of these platforms.
Serverless in Web Core
We make use of serverless in two of the high CPU intensive areas of Web Core. The first is the React app that renders the HTML. This layer understands which visual components make up a page, and fetches the data for them. The second is our business logic layer, which transforms data from many different BBC systems into a common data model.
Unlike other typical architectures we don’t make use of an API gateway to launch our serverless functions. Instead we have our own custom APIs running on virtual machine instances. These sanitise requests, forward traffic to the relevant serverless functions as well as handling caching and fall backs. These APIs are high network, high memory, low CPU services. This best fits a virtual machine instance over a serverless approach due to the availability of different instance types. In addition the scaling pattern for the APIs is slower and more predictable as traffic grows, compared to the high CPU workload carried out by our serverless functions.

A simplified version of the Web Core stack, requests enter at the traffic management layer.
So why the intermediate caching layers, why not just call two serverless functions one after each other?
Firstly to reduce cost. If we had serverless functions calling serverless functions directly without intermediate caching, we would be chaining them. This is a problem as we would be paying for the first to sit idle, waiting for the second to return. This can get expensive quite quickly, especially when service calls are involved. If this were a virtual machine instance, we would be able to run multiple requests in parallel, using the CPU’s idle time waiting for a request to return. But most serverless solutions have a one-to-one mapping between request and function invocation. Every request results in a new invocation, meaning the costs can quickly add up. Performance is therefore critical, but additional caching layers ensure most functions can complete in under 50ms.
The second benefit of intermediary cache layers is that we can perform content revalidation (e.g. stale while revalidate). This allows the presentation function to return a response to the audience quickly (and terminate the first serverless function) while the second serverless function runs and populates the cache for the next request.
Optimising our performance
Out of the box, serverless performs well and can easily handle large work loads that you throw at it. However, as it is the workhorse of our stack, we wanted to make sure we can get the most value out of it. The longer the serverless function runs the more it costs us, but also the longer the user has to wait for a response.
Most things you can do to optimise a normal application also apply to a serverless function, such as intelligent caching of data, reducing time waiting for other systems to respond, and reducing synchronous operations. For the purposes of this post we’ll touch on Lambda specific tuning that we have implemented.
Selecting the correct memory profile
Unlike virtual machine instances, Lambdas only have a single configurable “capacity” dimension — memory. Our React app is fairly low in terms of memory usage (~200Mb), so ideally we would pick the lowest value (and so lowest cost). However changing the memory setting also impacts the available vCPUs. This in turn impacts our response times and cold start times.
We performed load tests against each memory setting to determine the average response time. There is a critical point at which further increases in memory have no improvement in performance, but do increase in cost. In our case we found 1024MB as the optimal price/performance point.
Cold start times
When you make your first request to a serverless function, it must copy your code bundle to the physical machine and launch your ‘container’ for the first time. If you make a second request, it’s likely to hit the same ‘container’ that you previously launched. If two concurrent requests come in at the same time, the first hits the existing ‘container’ you have in place, and the second will need a new one starting up. It’s this start up time which is referred to as our cold start time. This happens every time we increase the number of concurrents from a previous high, or we deploy a new version of the code.
Some of the factors that can impact cold start time include memory allocation, size of the code bundle, time taken to invoke the run time associated with your code, and any initialisation you may choose to do before the serverless function executes.
As our website is mostly request driven, cold starts result in our audience members waiting longer. It also causes an increase in connections held open and so a significant slow down in serverless function execution times which can cause issues for any service waiting for that serverless functions to return.
One advantage of the cold start process is that you can take care of any initialisation that might be required for when the function executes. This allows the actual invocation to be as efficient as possible. You also don’t pay for the cold start period, so essentially a few free cycles you can use to optimise the performance of your function invocation later. We used this time to establish network connections to all the APIs which are needed (removing the need for SSL negotiation later) and we also loaded any JavaScript requirements into memory for use later. This means that we are not having to perform this logic during every execution.
As mentioned earlier, we went through a process of identifying the correct memory profile for our serverless function. During that process we discovered that the memory profile also impacted cold start times, with a 512 MB memory profile increasing cold start times by a factor of 3 over a 1024 MB cold start time.
So in tuning our cold start times, we struck a balanced approach between per invocation overhead and per cold start overhead.

A graph showing minimum, average and maximum cold start times over a week for our react rendering function. The X axis is time, Y axis is cold start duration in milliseconds.
In terms of overall cold start performance, it’s very predictable, with our average cold start time sitting around 250ms, and our maximum peaking around 1 to 2 seconds depending upon time of day.
What type of performance do we see?
We are performing over 100 million serverless function invocations per day. The performance of each invocation is predictable and performs as we would get from a virtual machine or container based service. Our HTML render times are quick, with the p90 being around 220ms. This time includes the time taken to fetch the data from our data services.

A graph showing the average and p90 response times of our presentation React app serverless function over a 4 week period. X axis is time, Y axis is duration in milliseconds.
In terms of scalability, during benchmark tests we were able to go from a cold system at 0 rps with everything uncached to 5,000 rps within a few minutes. We would have tried a faster scale up, but we didn’t want to break our internal content production infrastructure. During our production use we have not seen a single function invocation fail. At 100 million requests a day, that’s some achievement.
Diagnosing and debugging
One of the disadvantages of serverless is the lack of a platform to remotely diagnose during an operational incident. If something went wrong whilst using an EC2 instance, once you’d exhausted logs and monitoring, you would typically SSH into the box and diagnose the health of the running device.
Moving to serverless for our compute has meant us having to adopt other platforms to support monitoring and debugging. To do this we make use of a combination of X-Ray and CloudWatch, brought together via Service Lens. Other platforms from other providers are available to do this including DataDog and GitLab.
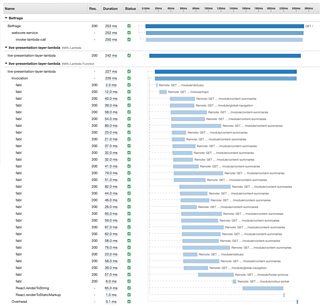
A screenshot of an X-ray trace showing the service calls and timings of rendering our homepage.
On every request that enters our stack, we annotate the request with a trace identifier. As the request navigates our stack the request maintains the id. This allows us to build a graph of each request through the system, along with a timing waterfall.
If an individual page is erroring, we can look at the traces generated by that URL and understand where in the stack that issue lies. Through the Service Lens interface, we’re able to provide all the log files for that trace in a single place, which enables us to view any stack traces or errors generated by the code.
We have found that this form of debugging has enabled us to go from being notified of an operational incident to a log stack trace in a very short period of time, which is great for ensuring our website stays available and up to date.
Deploying to Live
One of the big surprises with serverless was the way in which it changes your approach to environments and deployments. Typical virtual machines require you to build an image and deploy rolling changes out to your infrastructure. If you want to run two builds concurrently (e.g. staging and testing) you would need a separate infrastructures running that software.
With serverless, it’s slightly different. We package and upload our code and it sits there ready to be invoked, at any scale, but critically in isolation away from the other versions you have already uploaded. Containers do operate in a similar fashion, but could still impact the underlying hardware on which your critical service might be running.
Within the Web Core project, we have the ability to build and deploy our serverless function on each commit to GitHub (although typically we wait until the pull request stage). This can then be invoked by a developer, tester or product owner and get the full functionality as it if were audience facing, even when it’s in development. In essence this gives us an environment per pull request!
When a feature or change is ready for deployment, we alias the function to deploy the change to live. Making a particular commit hash the ‘production’ alias, will expose that serverless function to the audience. A rollback is just a case of updating the alias again.
Thanks for reading!
The platforms that run BBC Online are always evolving and changing as our technology providers improve their services. We’re always on the lookout for how we can deliver the best audience experience. The BBC website can reach 60 million browsers a day, with our users requesting up to 20k pages per second.
Compute comes in many flavours, and after careful consideration we chose to use serverless for the task. We are now running over 100 million serverless function invocations per day, with the technology being cost effective, able to respond quickly to changes in demand and performant to audience requests.
The technology has worked well from the outset, however we have learned a number of tricks to improve its performance (including optimising cold start times and behaviour). We have also overcome some of its limitations by adding non-serverless layers to our stack.
We have been able to take advantage of the monitoring services integrated with serverless, improving our ability to diagnose and debug issues quickly. Thanks for reading.